Author: Heike Blecher

Is a negative ROI acceptable when acquiring new customers?

Header


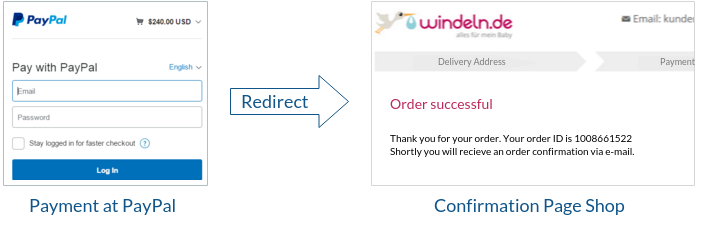
In our last article we talked about the importance of differentiating new from already existing customers. We used the example of a SEA Ad as an illustration. We differentiated new and returning customers and calculated a negative ROI for the newly acquired customers. That is typical and we see that often. In these situations, marketers tend to reduce the bids or cancel the entire campaign. At the first glance, this seems to be the right decision because running profitable campaigns should be every marketer’s core concern.


However, is cancelling the campaign truly the right decision?

Well, not so fast. Halting the campaign might be wrong. To truly decide if a campaign targeted towards new customers really should be stopped or not one must consider the “customer lifetime value”. Customer Lifetime Value accounts for the entire relationship with that customer over time. Drivers for that value are all future revenues and additional contribution margins. Additional future marketing cost to reactivate that customer a detractor of that customer lifetime value. Often the sum of future revenues and margins generated by one customer are bigger than today’s marketing cost. Marketers should consider those future contributions and accept a negative ROI today IF that ROI will turn positive over time.


From one customer to groups of customers – Consider Cohorts

To estimate the “customer lifetime value” marketers should consider groups of customers, so called “cohorts”.  A cohort here is a group of customers with a common characteristic. Typically, this characteristic refers to the campaign with which these customers have been acquired. A cohort also requires a specific time period like a day, calendar week or month. For example marketers should evaluate the lifetime value of all customers that were acquired via Google Adwords within one calendar week (starting point) and observe their additional revenues in the coming weeks.

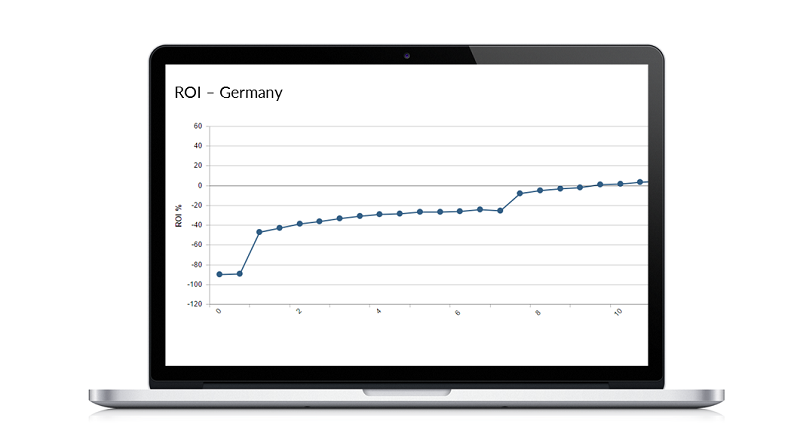
Below is the example of a group of customers that were acquired in “week 0”, their revenue in that first week and the cumulated net revenue derived from that group of customers over the next 20 weeks:

cumulated revenue

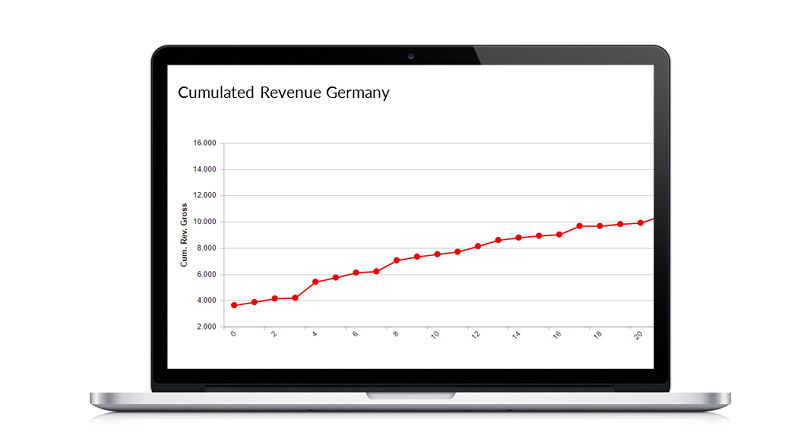
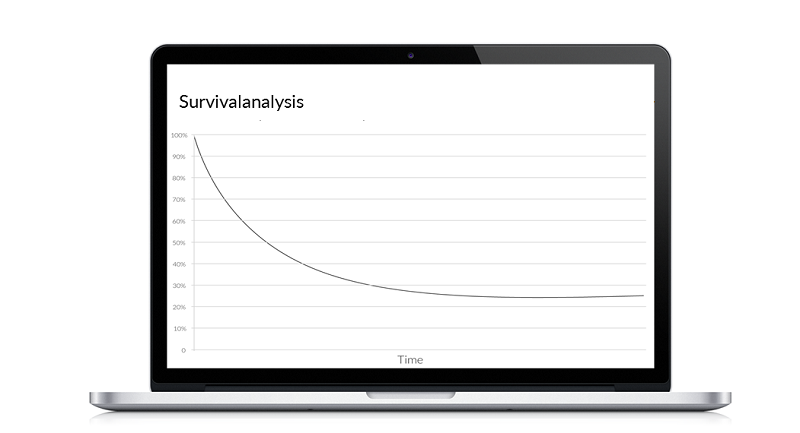
An additional way of observing the behavior of that group is to measure “active customers” and the general cohort’s life. The example below shows that over time about 25% of customers are still “active” (i.e. actively purchasing products and services).

EN Sruvivalanalyse


What’s the result?

Even though a negative ROI has been calculated at the beginning of a campaign, you are now able to observe whether this cohort did generate additional revenues and eventually became profitable over time. In many industries time periods of 3 or 6 months are typical until the breakeven is reached. Industries like dating, gaming and financial products often have to expect breakeven points after a year or even longer.

EN ROI


Advantages

There most important benefis for cohort and customer lifetime value analysis is an an increased customer reach and stronger growth of the customer base. Campaigns are actively run for longer time periods reaching more customers that all contribute to a campaign’s profitability over time.


Requirements

The most important requirement for a final evaluation of cohorts is clean customer data and a correct assignment of customers to their cohort. In addition, it takes time (often weeks or even months) until a campaign and its actual ROI can finally be evaluated.

If you want to examine a campaign’s efficiency and the expected ROI shortly after it was launched, you should invest into Customer Lifetime Value PREDICTIONS.

CLV Prediction

A later article will explain the approach towards customer lifetime value prediction in detail.

Differentiating New from Returning Customers

Header

In our previous blog posts we often emphasized the importance of a correct tracking (for example by using UTM parameters) to optimize the profitability of every marketing campaign.
In this article, we want to provide you further advice on how to further optimize your reporting by differentiating between new and returning customers. The objective of this differentiation is again to better analyze and optimize the profitability of all marketing activities.


The Problem

At various Applicata projects we often realize that online marketers optimize their marketing campaigns simply for breakeven or aiming for a slight profit. That is quite alright. But it is this sufficient?

As an example, imagine you run a campaign via Google Adwords which is targeted at the acquisition of new customers. Typically, the campaign’s effectiveness is analyzed regularly with a report that typically looks like this example:

General table

Simply spoken out of 4150 orders and marketing cost of over €100.000 the return on investment (ROI) is 2%. Does this answer the question if you achieved your goal of acquiring new customers? Well – not quite…


Every report should be differentiating new from returning customers

The previous example does not give you any information about your set goal. You do not know whether you did acquire a lot of new customers or if the campaign only attracted existing customers. That is because the report does not differentiate between new and existing customers. If you achieved your goal is still unclear.

Often new customers are a lot more expensive than existing ones, which means that the interpretation of the calculated average values is misleading. We always recommend our customers to precisely differentiate between new and returning customers in every marketing campaign.

Such a report could look like this:

Detailled table about new and returning customers

Now you can see that the average ROI of 2% is made up of the highly positive ROI of 275% of returning customers and the negative ROI of -33% of new customers. In a combined reporting the “cheap” returning customers cross-subsidize the “expensive” new ones enormously.

A marketer should evaluate the report and decide whether the campaign needs to be adapted or not:

  1. Have enough new customers been acquired and has the goal been achieved?
  2. Is the negative ROI of new customers acceptable or should bids and budget be reduced?
  3. Are there other possibilities to reach existing customers? For example, via e-mail or retargeting or push notifications in order to save costs.
  4. Are there special keywords in the campaign which brought back existing customers? Should these keywords maybe be pulled to an extra campaign for returning customers?

Is the reporting of Google Analytics and Adwords enough?

Adwords

Many companies use the tools of their media partners for their reporting (e.g. Google Adwords Editor, Google Analytics, Facebook Campaign Manager, etc.)

However, you cannot connect these tools to your shop system and as a result cannot differentiate between new and returning customers.

Even Web Analytics tools such as Google Analytics cannot do this. Google Analytics identifies returning traffic but only within 30 days and does not provide any data whether this returning visitors is a new or an existing customer. For example, if a customer did buy something in your online shop a year ago, Google identifies him/her as an “expensive” new customer, although he/she is in all actuality a returning customer.


The Solution

To guarantee a clean and correct reporting of your marketing campaigns we recommend combining data from your tracking solution (e.g. Google Analytics) with your shop data (customers, transactions).

differentiated reporting

In addition to Google Adwords we recommend differentiating between new and returning customers in all your marketing channels (Display, Affiliate, Social Media etc.). The easiest way to do that is to deploy a professional business intelligence solution like Applicata, which also has lots of other advantages.


Tips for correct e-commerce Tracking

startup-desktop_925x

In this post we explained how to use Google Analytics‘ UTM parameters for tracking. Another important feature in Google Analytics is „E-commerce Tracking “.
In what follows we want to take a closer look at e-commerce tracking discussing likely problems and solutions.


What is E-Commerce Tracking?

E-Commerce Tracking means gathering information about purchase activities on a website and sending them to Google Analytics. This is information about products, transactions, order value, time, order ID and other data. For this it is necessary to implement a tracking code into the website code. When the website is loading this tracking code creates a transparent pixel (also called tag) that sends data to Google Analytics.


Why is E-Commerce Tracking important?

In order to make this clearer to you, we provided an example:
Imagine that a potential customer found her way to our online shop. You spent €30 marketing budget in campaign XYZ on Google Adwords for her. As you are using UTM parameters you know that she found our shop through that specific campaign XYZ.
Now the customer buys products for €220 gross. By means of e-commerce tracking you can gather relevant data of the purchase, especially the order value and the order ID.

In Google Analytics you can look up the marketing costs (coming from Google Adwords) and gross sales of this purchase. As a result you calculate a customer value of €190 (€220-€30).

Your Magento shop system also recorded the €220 purchase but then had to accept a cancellation of the most expensive product in the shopping cart. In the end, the customers net order value was only €20.
We assume that the shop system is connected with the ERP system which has information about the material purchase value. In our example let’s assume it is €5 (your cost to purchase the teddybear from your supplier), which means that our customer value shrinks to only €15.

The Applicata BI Software connects Google Analytics campaigns and cost data with the shop system data and the marketing costs. Now the actual true customer value can be calculated and turns out to actually be negative:
[customer value Magento €15] – [marketing costs Google Analytics €30] = [customer value €-15].

This clearly shows that e-commerce tracking is highly relevant in order to connect marketing information of an order with the net order value and the contribution margin of this order!

EN-e-comm_tracking

Applicata compares order IDs and merges all data. If the customer returns and buys more products in this shop, Applicata determines automatically the new customer value.


How to set up E-Commerce Tracking?

First you need a Google Analytics account. There you receive the tracking code snippet which creates the pixel on your website. It needs to be implemented on every page. Therefore, you need HTML and JavaScript skills or you use a Tag Manager (see below “Google Tag Manager).

To integrate e-commerce data in your Google Analytics reports, e-commerce has to be enabled for each view in which you want to see the data.The Google Support provides detailed information on e-commerce set up.


Google Tag Manager helps with many tags

In case there are lots of tags (find supported tags here) to handle that send information to a third party, it is recommended to use the Google Tag Manager.
This is a single container tag that also needs to be implemented on each site, but once it’s done every other tag can be added and configured via a user interface. No further coding knowledge is needed.


What is the Problem with E-Commerce Tracking?

In Applicata’s experience companies using E-Commerce Tracking often do not track more than 20% of their transactions correctly. This means that they cannot determine revenue, customer acquisition costs and costs/revenue ratio for more than 20% of their orders.


6 Common Reasons for Incorrect E-Commerce Tracking and Solutions:

What follows demonstrates several problems concerning e-commerce tracking we often see and solve in Applicata projects.

  1. Google Pixel is not firing

    If the pixel is not triggered while the website is loading, it cannot send any data to Google Analytics. In this case you should set up test orders in different browsers and from different devices. This is how you can identify which combination of browser and device blocks the tracking. Mostly the reason is found on your own website and you should call in a developer.

  2. PayPal auto return is not working

    If a customer decides to buy a product and chooses PayPal for payment he or she will be directed to PayPal. The payment is executed externally at PayPals website. As soon as the payment is finished, the customer should be redirected to the shop automatically. There he or she should be led to the confirmation page with the order ID. The confirmation page is very important because this is the place where the tracking pixel fires and sends the order data to Google Analytics. In many cases PayPal is not implemented correctly and the so called ‘Auto Return‘ to the shop website is not triggering the pixel.
    EN_PayPal_redirect

    It can also happen that the customer closes the PayPal page after payment and a redirect to the confirmation page is no longer possible.
    Very often we notice that the utm_source parameter is overwritten during auto return.
    In this case Google Analytics takes PayPal for the referrer although the actual origin is different. In this case the information how the customer came to your website would be lost for everyone who paid with PayPal.
    The solution is to modify the following settings at PayPal to fix ‘Auto Return’:

      Log into PayPal
      Go to ‘My Profile‘ and select `My Selling Tools‘
      Click on ‘Website Payment Preferences‘
      Switch on ‘Auto return‘ and enter the URL of your confirmation page
      Add an utm_parameter to the URL which prevents the original parameters from being overwritten: ?utm_nooverride=1
      For example:https://www.my-shoeshop.com/ thankyou.php?utm_nooverride=1

    In case you are using Googles Universal Analytics you do not have to add ?utm_nooverride=1. You simply add paypal.com to your ‘Referral Exclusion List’. The same applies to all other online payments systems.

  3. Insufficient Website Encryption

    All websites that receive user data should have a save HTTPS (Hyper Text Transfer Protocol Secure) connection. No matter if it is an online shop or online banking.
    Other than a HTTP connection HTTPS transfers encrypted data to the server.
    There can be a problem when only some parts of the website are encrypted and others, pictures for example, are not. This can cause the tag not to fire and thereby not to send e-commerce data to Google Analytics.
    To be completely sure that incorrect tracking is not caused by an insufficient encryption you should always encrypt the whole ordering process. Encrypting the whole website is even better.

  4. Website loading takes too long

    Some companies are not using a shop system like Magento or Demandware. They build their own proprietary an online shop. In these cases, we often recognize that the websites are loading far too long. The problem is that slow loading pages can prevent the tracking pixel from firing and consequently no data will be sent to Google Analytics.

  5. Tags interfere with each other

    The tracking code snippets that create the pixels are placed in the website’s source code one after the other. While loading the website the code is read from top to bottom including the tracking code. If there is a buggy snippet of, for example, an affiliate system it prevents the following snippets from being read. The website loading is interrupted at this point. So, if the Google tag is located after the buggy code it cannot be read and executed anymore. In this case no e-commerce data will be sent to Google Analytics as well. It is preferable to use the Google Tag Manager.

  6. Google Tag Manager fires the wrong tag

    Wrong configuration can be a problem. Common problems with firing tags from Google Tag Manager have already been described here.


Conclusion

To evaluate the efficiency of marketing efforts Google Analytics is a very helpful tool.
Correct set up of e-commerce tracking is a basic requirement to ensure a clean connection of marketing and order data.
Through systematic elimination of every possible source of error we achieved over 98% e-commerce tracking rates with our customers that started with a 70% rate. This means that about 30% of their orders were not tracked correctly until the problens were solved as part of the Applicata BI Implementation project.

Business Intelligence vs. Google Analytics – Why is a business intelligence solution indispensable for companies?

Header

Data, analyses, predictions, marketing automation and “business intelligence” (BI) gain more and more importance for companies of every size and branch in this “area of digital transformation”.

With the help of a BI solution all relevant information from different data sources of a company can be gathered, reviewed and analyzed, in order to generate new insights about the efficiency of every marketing activity, customers and products as a basis of growth and profitability.

From our experience at Applicata, we know that many companies, especially small- and mid-sized ones, still relinquish the use of a business intelligence solution. Most companies, however, use the free tool “Google Analytics” (GA) for their analyses and wonder why they should additionally use a BI solution.

In order to showcase the advantages of a business intelligence (BI) solution, we prepared a direct comparison between BI and GA


Business Intelligence

Google Analytics


Easy integration of different data sources:

A BI solution automatically integrates marketing, customer, product and shop data from various sources in one software.

No integration of other data sources:

Google mainly registers website accesses and the customers’ behavior on the website. The ability to integrate information from other sources is limited.

Datenquellen


Correct e-commerce data:

Due to the import of customer and product data from the shop and ERP system, data within the BI are 100% correct.

Sampled data:

In the free version, Google only offers aggregated data but does not provide raw data. The e-commerce tracking is cookie based and error prone.

Daten


Correct cost allocation:

The costs of individual marketing channels and activities are gathered automatically. Therefore, the profitability can easily be calculated.

No individual consideration of costs:

In order to consider marketing activities and channels in regard to their profitability, cost data mostly need to be gathered manually and imported with great effort.

Kosten


Automated creation of dashboards and reports:

As all a company’s data is being aggregated in one software, dashboards and reports are created automatically. Therefore, all the available data can easily and flawlessly be analyzed and marketing activities can be optimized.

Manual creation of dashboards and reports:

As you do not have access to all your companies’ data in GA, dashboards and reports need to be created manually outside of GA usually using Excel. This is however time consuming and highly error prone which leads to incorrect information.

Dashboard


Specific information:

A BI solution supplies exact data: what website visits led to orders & transactions, whether these were new or existing customers and which source had the most visits leading to transactions.

Basic information:

Google Analytics only supplies basic information about the amount of website visits, the length of each access and the bounce rate.

Informationen


Predictions:

Within a BI you can automatically create predictions of the performance and profitability of every marketing activity.

No predictions:

The Google tool does not offer any functionality to create predictions for future performance and profitability.

Prädiktion


This comparison clearly shows that a BI solution has significant advantages compared to Google Analytics. Nevertheless, we do not want to badmouth Google Analytics or downplay its importance. When it comes to Marketing ROI analysis Google Analytics alone just does not suffice and a BI integrating various data sources is needed. Every business intelligence solution however does rely on Google Analytics (or other web analytic tools such as Webtrekk or AT Internet) as an important data source.

A BI’s advantages, therefore, arise out of the accumulation and abundance of various data sources’ data. Applicata offers you exactly these advantages in one software. In various projects with our clients, we combine data from more than 20 data sources. Based on this aggregated and reliable data our clients create self-service dashboards and reports. The BI is also being used to calculate predictions about customers’ behavior and to optimize all marketing activities.

BI_vs_GA_EN

Correct URL Building with the help of Applicata

Header

In the latest article UTM Tagging Explained we talked about the importance of correct URL tracking for entrepreneurs, in order to analyze customer data correctly and to optimize every marketing activity.

The most important tips for correct tracking:

  1. Use of consistent standards
  2. Consistency of notations
  3. Correct notations (use of capital and small initial letters)
  4. Do not mix up source & medium
  5. Adding of sub-domains

Even though companies put emphasis on correct URL tracking from the beginning, corporate growth, especially increasing numbers of employees and growing, international expansion, lead to an increasing complexity of marketing activities. Therefore, it becomes more difficult to ensure correct tracking data. Growth and expansion are often correlated to marketing campaigns on several channels and in cooperation with many partners in different countries. Due to this complexity and human errors it happens that consistent tracking standards cannot be enforced any longer. But inconsistent tracking data leads to incorrect marketing reports.


URL Building with the help of GoogleCampaign-URL-Builder-Google

Many marketers trust Google Analytics’ free UTM Builder when building UTM tracking links. Although this tool has a clear UTM structure for every campaign, mistakes and inconsistencies are predestined using it. Why? Because every box needs to be filled in manually. This is problematic if for example several employees work on the generation of URLs for different campaigns. Errors frequently occur because of mistakes like using small and capital letters, a mix-up of UTM source and medium or inconsistent notations (aff vs. affiliate, scm vs. social media etc.).


URL Building with the help of Excel

In order to avoid such mistakes the use of excel files or Google Docs is an alternative to the Google UTM Builder. This works better in general because standardized tracking structures for every channel can be established.

Such a file with UTM parameters can be quite helpful for companies in their start-up phase. That is why we created a UTM Tracking Parameters file which is available for free download below.

URL-Building-Excel


You can customize this file to your company specific tracking requirements and use it for the generation of campaign URLs.

Nevertheless, we often see here at Applicata that mistakes are also made in such documents when it is being used by several employees. As already mentioned, Google already matches campaigns differently according to the use of small and capital letters or different notations of a specific value. As a drop-down menu and a central administration of UTM options is missing, the generation of URLs with the help of this Excel File or Google Docs is still highly error prone.


The Problem

Google cannot match traffic to its correct channel and its correct campaign when using incorrect UTM tracking links. That is why often a big part of the traffic is placed into the categories “unallocated” or “other”. This means that Google tracked the traffic, however, cannot relate it to a specific channel or partner.

Reallocation-Other-Unallocated-1

We already saw projects in which nearly 30% of the whole traffic has been matched incorrectly or lumped into “other”.

If website visits cannot be counted back to their correct campaigns, every analysis and report of this campaign is incorrect, too. The optimization of marketing activities based on wrong data leads to wrong budget allocations between marketing activities, too high expenses, lost revenue and consequently, to low profitability of your company.

The goal is to always track the traffic to its correct channel and partner.

Reallocation-Others-Unallocated


The Solution

In order to counteract the error rate and the resulting problems of the Google UTM Builder and a solution based on Excel, the Applicata software includes two tools, which ensure a consistent and correct generation of URL tracking parameters:

  1. The Campaign Builder

With the help of the campaign builder every marketing manager can generate a UTM tracking link for every campaign, partner and country when using Applicata.

Campaign_add

Due to the use of a drop-down menu the selection of UTM parameters is always correct and consistent. Furthermore, the tracking link can easily be copied and pasted for every advertisement and every website visit can thus be matched to the right campaign in Google Analytics.

Campaign_view


  1. Mapping Tool

If somehow tracking a link was built incorrectly and incoming traffic henceforth was allocated incorrectly, a second valuable tool within the Applicata Software can correct this for you: the mapping tool.

This tool is an interface in which incorrect UTM trackings can be mapped to their correct place in the campaign tree. Consequently, website visits can be related to the right campaign, source and medium.

Example: Let’s assume there was a spelling mistake. The visit data of the incorrectly tracked campaign can easily be redirected to the right one.


Mapping_Tool

Wrong: Source = affilient

Correction with the mapping tool

Right: Source = affilinet


Due to this correction, incorrect website visits can be redirected and correct campaign reports can be established.

This in turn is the basis for optimized budget allocations, growth and higher profitability.


p.s. So far, we did not find a way to export the corrected UTM tracking data into Google Analytics in order to correct the allocation of these campaigns in Google Analytics as well. We would be grateful for a hint how this could work.


Carsten Petzold – Interview about Marketing Costs and Raw Data

carsten-blog-header-EN

1. Can you describe Applicata in three sentences?

Applicata is a software-as-a-service company which deals with business intelligence and online marketing. Based on actionable insights we can help our clients to grow faster and more profitably. Additionally, we offer special business intelligence consulting services.


“In my previous company I analyzed data by myself in Excel. That was unreliable, slow and inconsistent.”

2. Why did you incorporate Applicata?

My co-founder Sebastian Rieschel incorporated the company and I joined in later. I spent my entire career with e-commerce start-ups and and first hand experienced the struggles that we now solve for our customers. I know how it is to run complex marketing campaigns across several channels.

In my previous company (www.ltlprints.com), I built a solution to analyze data by myself in Excel. With the help of macros, I established dashboards and evaluated reports in Excel manually.

However, this self-built Excel solution was unreliable, error-prone, slow and I never had the consistent data basis, I wished for.

Applicata offers exactly that: quickly available and correct data of all key figures in the company. See the tremendous benefit of Applicata I joined the company with great excitement shortly after the incorporation. But there is also a personal side of the story. With Sebastian I found the right partner with whom I want to build up Applicata on a long-term basis.


“Companies should be willing to invest more upfront and determine the “customer lifetime value” to optimize the long-term relationship.”

3. From your experience, which are the most common mistakes made in online marketing?

  1. In most companies, there are experts working only on their marketing channels, optimizing their channel individually as if they were independent of all other marketing activities. However, this focus is insufficient for an overall optimization of all marketing campaigns. The mutual interference of the individual channels should be taken into consideration in one consolidated Multi-channel marketing approach.
  2. Often the focus of companies is not set on return on investment (ROI) or return on adspent (ROAS) but rather on “Vanity KPI” (i.e. key performance indicators that are nice to look at but really do not matter in the end), such as web site visits, revenue and bookings. This mainly stems back to inconsistent and manually aggregated data. Lacking automatically aggregated marketing costs and margins companies often fail to achieve full cost control. But without cost control companies cannot manage their marketing activities by ROI of every advertisement and contribution margin per customer.
  3. Another problem is that many companies lack a concise view on every individual customer due to missing raw data. For example: Many companies simply use data from Google Analytics to analyze web site visits. Google Analytics however does only provide sampled data (at least in the free version). That means, you never know exactly which individual user clicked on what advertisement(s) before visiting your website. Good raw data both about offsite and onsite behavior and an individual buying history of every customer, however, is the basis for efficient online marketing.
  4. Companies often only invest as much money in their customer acquisition as they immediately return in form of a net contribution margin of the first order. However, companies should be willing to invest more upfront and accept a negative contribution margin for the first order If they can determine the “customer lifetime value” (CLV) of every customer. Applicata’s clients achieve growth and sustained profitability by accepting losses on the first order while optimizing the long-term relationship with and boosting the customer lifetime value of every new customer.

“Deploying a scalable and flexible 3rd party BI solution is always cheaper and faster than a self-built solution.”

4. What should start-ups consider when they seriously want to come in touch with business intelligence?


Firstly, they should get in touch with industry experts to get a feeling for the opportunities of a BI investment. A vision for corporate growth through business intelligence and a data-driven culture needs to be derived. Due to a lack of experience, founders often do not know and grossly underestimate how much can be achieved by using a BI solution.

Furthermore, start-ups should map out a corporate growth strategy. A BI software-as-a-service by itself is insufficient. Online companies need to establish teams and acquire skills to exploit the full potential of business intelligence solution.

Additionally, I recommend that every online start-up should make a detailed cost-benefit analysis of an external software solution versus a self-built solution. One should not be blindsided by the efforts and hidden cost of an inhouse business intelligence solution. Considering all direct and indirect cost, deploying a scalable and flexible 3rd party BI solution is usually 7 to 10 times cheaper and faster than a self-built solution.


5. What does your perfect free day look like?

My perfect day starts with sport – going jogging. After having a nice family breakfast, I spent the day with my family on an adventure playground or at a lake away from Berlin. In the evening, I savor great conversations with my friends and a glass of wine in front of a fireplace.