Business Intelligence

End-To-End Conversion Analysis with Google Analytics and Salesforce

Introduction

Many business models in the online world face one challenge: the modelling of the complete conversion funnel. Through online marketing measures i come into first contact with my customers (Lead-Generation). But i only sell to them later offline – outside of the user session on my site. This poses a problem to most online Tracking tools. Only the first contact is tracked as a success, but not the actual transaction, that brings revenue for my company.

For example at smava.de my team and i had this problem: we were brokering consumer loans online. The customer had to fill out a long online form to apply for a loan. But the deal was only done after the customer also had registered with his local post office (postident) and sent in some papers, which only happened in a fraction of cases. In the tracking tool we could ony see the submitted applications (leads), but not the finally paid out loans (sales).

The setup

viessmann-logoWith a similar challenge German heating manufacturer Viessmann AG contacted us: via diverse online initiatives (e.g. the domain heizung.de) customers become aware of Viessmanns products und can request further information via an online form. This data is then pushed via Javascript to Salesforce, where a CRM Team picks up the Lead, qualifies it and hands it over to a local heating installer. When he does the sale, it becomes visible in Salesforce as well. But how can they now connect costly online marketing measures to the sales? Google Analytics reports the attribution of conversion events to campaigns, but no the sales.

Solution Approach

Our consulting approach aimed at the following solution: At the time of lead generation the websites pushes customer data to Salesforce. Simultaniously, Google Analytics registered a goal completion. The problem with this: Both events cannot be connected after the fact. Whats missing is a Unique identifier, that makes the event traceable in both systems. With the help of a small JS Script we generate the identifier (10digit alpha-numeric string) and push this together with the customer data both to Salesforce and to Google Analytics ecommerce tracking, which allows to collect the so called transactionid.

Salesforce Analytics Tracking Setup

This way, we can rejoin data from both worlds after the fact:
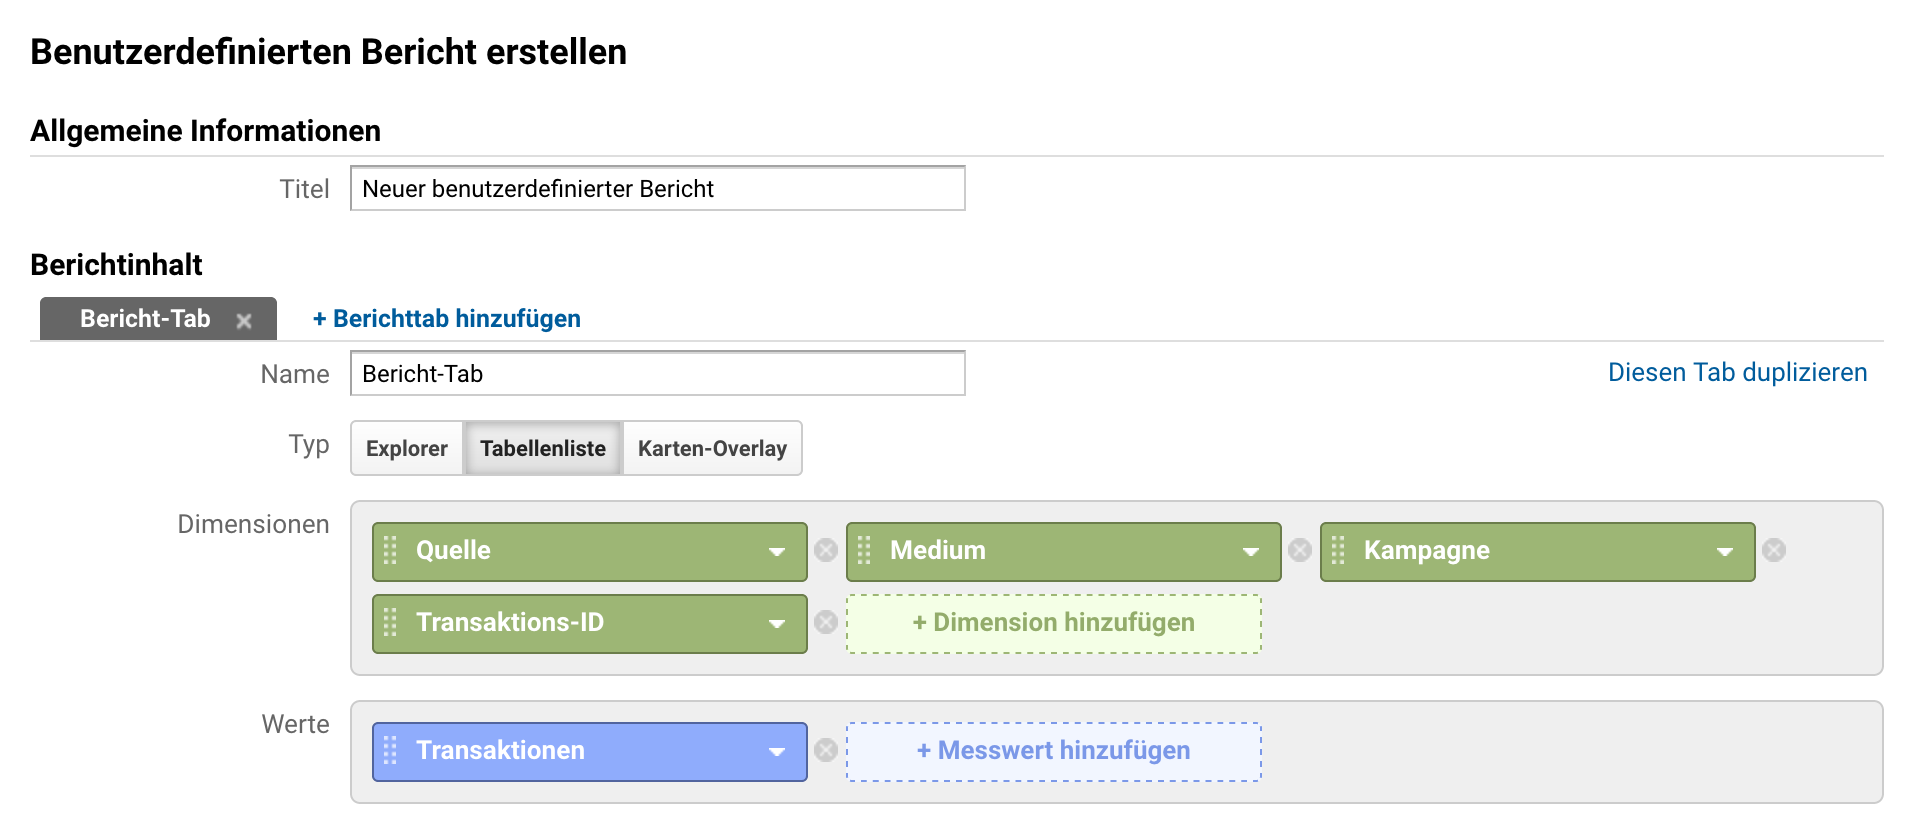
Google Analytics assigns every transactionid to a campaign and channel in a custom report:

ga_custom_report_def Analytics custom ecommerce report

Salesforce tracks all Leads and their status using the unique identifier. So, for each and every lead we can check if a sale happened.

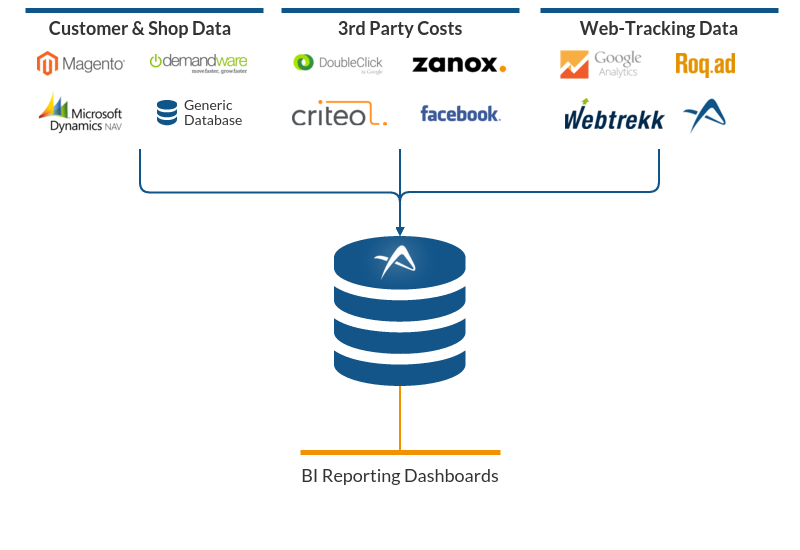
Our tool setup followed: Applicata imports data from both systems and joins it in a meaningful way, to enable ROI analysis. Applicata comes with premade connectors to both Google Analytics and Salesforce, so implementation was a matter of days.

applicata etl setup

Results

The Viessmann marketing team is now able to work with daily automated reports, that show sales success of individual campaigns. This way, on a daily basis, the team makes decisions about campaigns that are more profitable than other and allocates Budget optimally. In addition, based on the available data the CRM team creates Conversion reports, which it uses to monitor their performance and improve. Besides the team in Germany also Marketing staff from other EU countries uses applicata for their Reporting. Each country only has access to its own data.

Differentiating New from Returning Customers

Header

In our previous blog posts we often emphasized the importance of a correct tracking (for example by using UTM parameters) to optimize the profitability of every marketing campaign.
In this article, we want to provide you further advice on how to further optimize your reporting by differentiating between new and returning customers. The objective of this differentiation is again to better analyze and optimize the profitability of all marketing activities.


The Problem

At various Applicata projects we often realize that online marketers optimize their marketing campaigns simply for breakeven or aiming for a slight profit. That is quite alright. But it is this sufficient?

As an example, imagine you run a campaign via Google Adwords which is targeted at the acquisition of new customers. Typically, the campaign’s effectiveness is analyzed regularly with a report that typically looks like this example:

General table

Simply spoken out of 4150 orders and marketing cost of over €100.000 the return on investment (ROI) is 2%. Does this answer the question if you achieved your goal of acquiring new customers? Well – not quite…


Every report should be differentiating new from returning customers

The previous example does not give you any information about your set goal. You do not know whether you did acquire a lot of new customers or if the campaign only attracted existing customers. That is because the report does not differentiate between new and existing customers. If you achieved your goal is still unclear.

Often new customers are a lot more expensive than existing ones, which means that the interpretation of the calculated average values is misleading. We always recommend our customers to precisely differentiate between new and returning customers in every marketing campaign.

Such a report could look like this:

Detailled table about new and returning customers

Now you can see that the average ROI of 2% is made up of the highly positive ROI of 275% of returning customers and the negative ROI of -33% of new customers. In a combined reporting the “cheap” returning customers cross-subsidize the “expensive” new ones enormously.

A marketer should evaluate the report and decide whether the campaign needs to be adapted or not:

  1. Have enough new customers been acquired and has the goal been achieved?
  2. Is the negative ROI of new customers acceptable or should bids and budget be reduced?
  3. Are there other possibilities to reach existing customers? For example, via e-mail or retargeting or push notifications in order to save costs.
  4. Are there special keywords in the campaign which brought back existing customers? Should these keywords maybe be pulled to an extra campaign for returning customers?

Is the reporting of Google Analytics and Adwords enough?

Adwords

Many companies use the tools of their media partners for their reporting (e.g. Google Adwords Editor, Google Analytics, Facebook Campaign Manager, etc.)

However, you cannot connect these tools to your shop system and as a result cannot differentiate between new and returning customers.

Even Web Analytics tools such as Google Analytics cannot do this. Google Analytics identifies returning traffic but only within 30 days and does not provide any data whether this returning visitors is a new or an existing customer. For example, if a customer did buy something in your online shop a year ago, Google identifies him/her as an “expensive” new customer, although he/she is in all actuality a returning customer.


The Solution

To guarantee a clean and correct reporting of your marketing campaigns we recommend combining data from your tracking solution (e.g. Google Analytics) with your shop data (customers, transactions).

differentiated reporting

In addition to Google Adwords we recommend differentiating between new and returning customers in all your marketing channels (Display, Affiliate, Social Media etc.). The easiest way to do that is to deploy a professional business intelligence solution like Applicata, which also has lots of other advantages.


Business Intelligence vs. Google Analytics – Why is a business intelligence solution indispensable for companies?

Header

Data, analyses, predictions, marketing automation and “business intelligence” (BI) gain more and more importance for companies of every size and branch in this “area of digital transformation”.

With the help of a BI solution all relevant information from different data sources of a company can be gathered, reviewed and analyzed, in order to generate new insights about the efficiency of every marketing activity, customers and products as a basis of growth and profitability.

From our experience at Applicata, we know that many companies, especially small- and mid-sized ones, still relinquish the use of a business intelligence solution. Most companies, however, use the free tool “Google Analytics” (GA) for their analyses and wonder why they should additionally use a BI solution.

In order to showcase the advantages of a business intelligence (BI) solution, we prepared a direct comparison between BI and GA


Business Intelligence

Google Analytics


Easy integration of different data sources:

A BI solution automatically integrates marketing, customer, product and shop data from various sources in one software.

No integration of other data sources:

Google mainly registers website accesses and the customers’ behavior on the website. The ability to integrate information from other sources is limited.

Datenquellen


Correct e-commerce data:

Due to the import of customer and product data from the shop and ERP system, data within the BI are 100% correct.

Sampled data:

In the free version, Google only offers aggregated data but does not provide raw data. The e-commerce tracking is cookie based and error prone.

Daten


Correct cost allocation:

The costs of individual marketing channels and activities are gathered automatically. Therefore, the profitability can easily be calculated.

No individual consideration of costs:

In order to consider marketing activities and channels in regard to their profitability, cost data mostly need to be gathered manually and imported with great effort.

Kosten


Automated creation of dashboards and reports:

As all a company’s data is being aggregated in one software, dashboards and reports are created automatically. Therefore, all the available data can easily and flawlessly be analyzed and marketing activities can be optimized.

Manual creation of dashboards and reports:

As you do not have access to all your companies’ data in GA, dashboards and reports need to be created manually outside of GA usually using Excel. This is however time consuming and highly error prone which leads to incorrect information.

Dashboard


Specific information:

A BI solution supplies exact data: what website visits led to orders & transactions, whether these were new or existing customers and which source had the most visits leading to transactions.

Basic information:

Google Analytics only supplies basic information about the amount of website visits, the length of each access and the bounce rate.

Informationen


Predictions:

Within a BI you can automatically create predictions of the performance and profitability of every marketing activity.

No predictions:

The Google tool does not offer any functionality to create predictions for future performance and profitability.

Prädiktion


This comparison clearly shows that a BI solution has significant advantages compared to Google Analytics. Nevertheless, we do not want to badmouth Google Analytics or downplay its importance. When it comes to Marketing ROI analysis Google Analytics alone just does not suffice and a BI integrating various data sources is needed. Every business intelligence solution however does rely on Google Analytics (or other web analytic tools such as Webtrekk or AT Internet) as an important data source.

A BI’s advantages, therefore, arise out of the accumulation and abundance of various data sources’ data. Applicata offers you exactly these advantages in one software. In various projects with our clients, we combine data from more than 20 data sources. Based on this aggregated and reliable data our clients create self-service dashboards and reports. The BI is also being used to calculate predictions about customers’ behavior and to optimize all marketing activities.

BI_vs_GA_EN